The Training and Placement Cell (TPC) is a vital department within educational institutions and universities, serving as a bridge between students, academic programs, and the professional world. Its primary objective is to facilitate the transition of students from academia to the workforce by providing them with the necessary skills, resources, and opportunities to secure internships, employment, or further education. The significance of the TPC lies in its role in enhancing students' employability, fostering industry-academia collaboration, and promoting the institution's reputation in the job market.
The institution has been instrumental in providing 100% placement assistance to the eligible students for placements in reputed national and multi national companies. The TPC is established way back in 2006, with the following objectives.
| S.No | Name | Designation | Role |
|---|---|---|---|
| 1 | Dr. A. Sirisha | Associate Professor | Coordinator |
| 2 | Mr. K. Vishnu | Assistant Professor | Member |
| 5 | Mr. K. Pavan Kumar | Student | Member |
| 6 | Ms. B. Aishwarya Yadav | Student | Member |
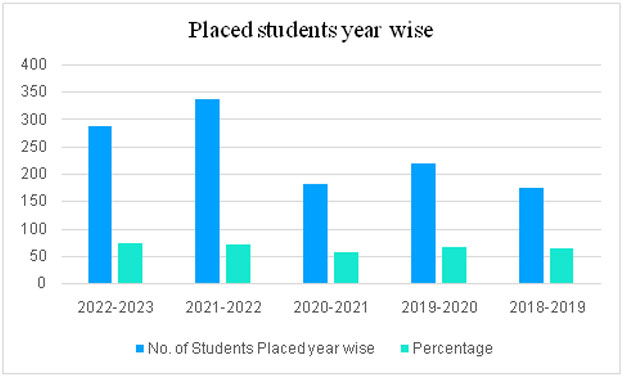
The following table illustrates the placement statistics over a span of four consecutive academic years, from 2019-2020 to 2022-2023. It details the number of students placed in each academic year alongside the corresponding placement percentages.
| Year | No. of Students Placed year wise | Percentage |
|---|---|---|
| 2022-2023 | 287 | 74 |
| 2021-2022 | 336 | 72 |
| 2020-2021 | 183 | 58 |
| 2019-2020 | 221 | 69 |
| 2018-2019 | 176 | 65 |
The same details showing in a bar chart in order to understand and interpret.
The following bar chart visualizes the placement statistics spanning four consecutive academic years, from 2019-2020 to 2022-2023. This chart provides a comprehensive overview of the number of students placed in each academic year, along with their corresponding placement percentages.
Over the past five years, the MBA program has observed fluctuations in the number of students successfully placed. In the most recent academic year, the department witnessed a significant increase in placements compared to the previous years. Conversely, there were slight declines in placement numbers in certain years, indicating variability in the job market or changes in recruitment strategies. Despite these fluctuations, the department has consistently endeavored to provide comprehensive support to students, ensuring they are equipped with the necessary skills and resources to secure employment opportunities. The data underscores the dynamic nature of the job market and highlights the importance of ongoing adaptation and enhancement of placement strategies within the department.
| Year | No. of Students Placed year wise | Percentage |
|---|---|---|
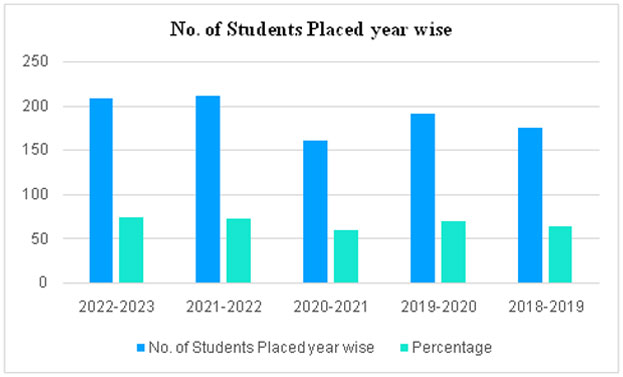
| 2022-2023 | 208 | 75 |
| 2021-2022 | 211 | 73 |
| 2020-2021 | 161 | 60 |
| 2019-2020 | 191 | 70 |
| 2018-2019 | 176 | 65 |
The same details showing in a bar chart in order to understand and interpret.

From the last four years there have been fluctuations in the placement outcomes for the MCA Program. Notably, the department experienced a significant surge in placements in the most recent academic year, contrasting with slight declines in certain preceding years. These fluctuations may suggest shifts in the job market landscape or alterations in recruitment methodologies.
| Year | No. of Students Placed year wise | Percentage |
|---|---|---|
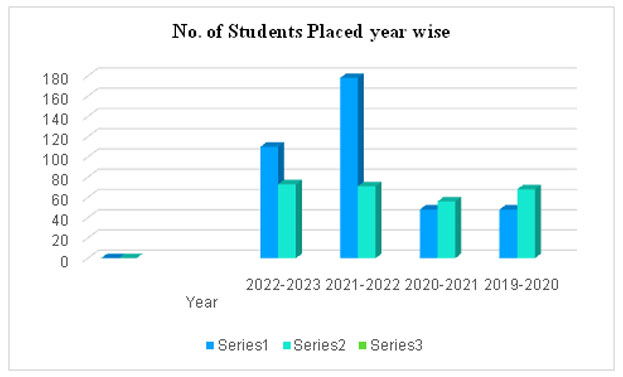
| 2022-2023 | 110 | 73 |
| 2021-2022 | 178 | 71 |
| 2020-2021 | 48 | 56 |
| 2019-2020 | 48 | 68 |
The same details showing in a bar chart in order to understand and interpret.
